Cartographer / GIS WEB DEV. / GIS DATA ANAL.

process geospatial data in Python, mainly expert in these packages: GeoPandas, Pandas, Shapely, OSMnx, ..., also familiar with the most popular GIS data formats: JSON, GeoJSON, shapefile, XML, CSV,...
have knowledge of machine learning and implement statistical models in R: SVM, Logistic models, clustering, PCA...
specilize in HTML/CSS/JavaScript to create interactive map websites, along with multiple popular map libraries: Mapbox JS GL, Leaflet.js, Turf.js, ArcGIS RESTful API, GoogleMaps API, foursquare API, HERE API, ...
implement JavaScript map visualization libraries: d3.js, ArcGIS API, Leaflet.js, ...
create maps with combination of multiple technologies: ArcGIS Pro, ArcMap, ArcGIS Online, Mapbox Studio, Illustrator, DataShader, ...
apply effectively domain knowledge of cartography, keeping gaining insight from GIS&T Body of Knowledge.
create ER-diagram and relational schema.
use PostgresSQL, PostGIS for geospatial data (spatial) query and geodatabase management.
Master's in GIS / Cartography @ UW - Madison
I love playing around location data.
6+ years of experience in spatial data analysis and geo-visualization.
Travelling is one of my favorites, which I can always find inspirations from, so I create a lot of interactive map tools as well as visualization map related to tourism. I develop a grand passion for inspecting spatial and temporal variability (heterogeneity) by creating interactive maps and static cartographic infographics, aimed at making the information more effectively understood by the public.
To be NING ... ;)

These works are mainly on 3 skills: Geospatial Data Analysis, Web GIS - Interactive Cartography, and Map Design.
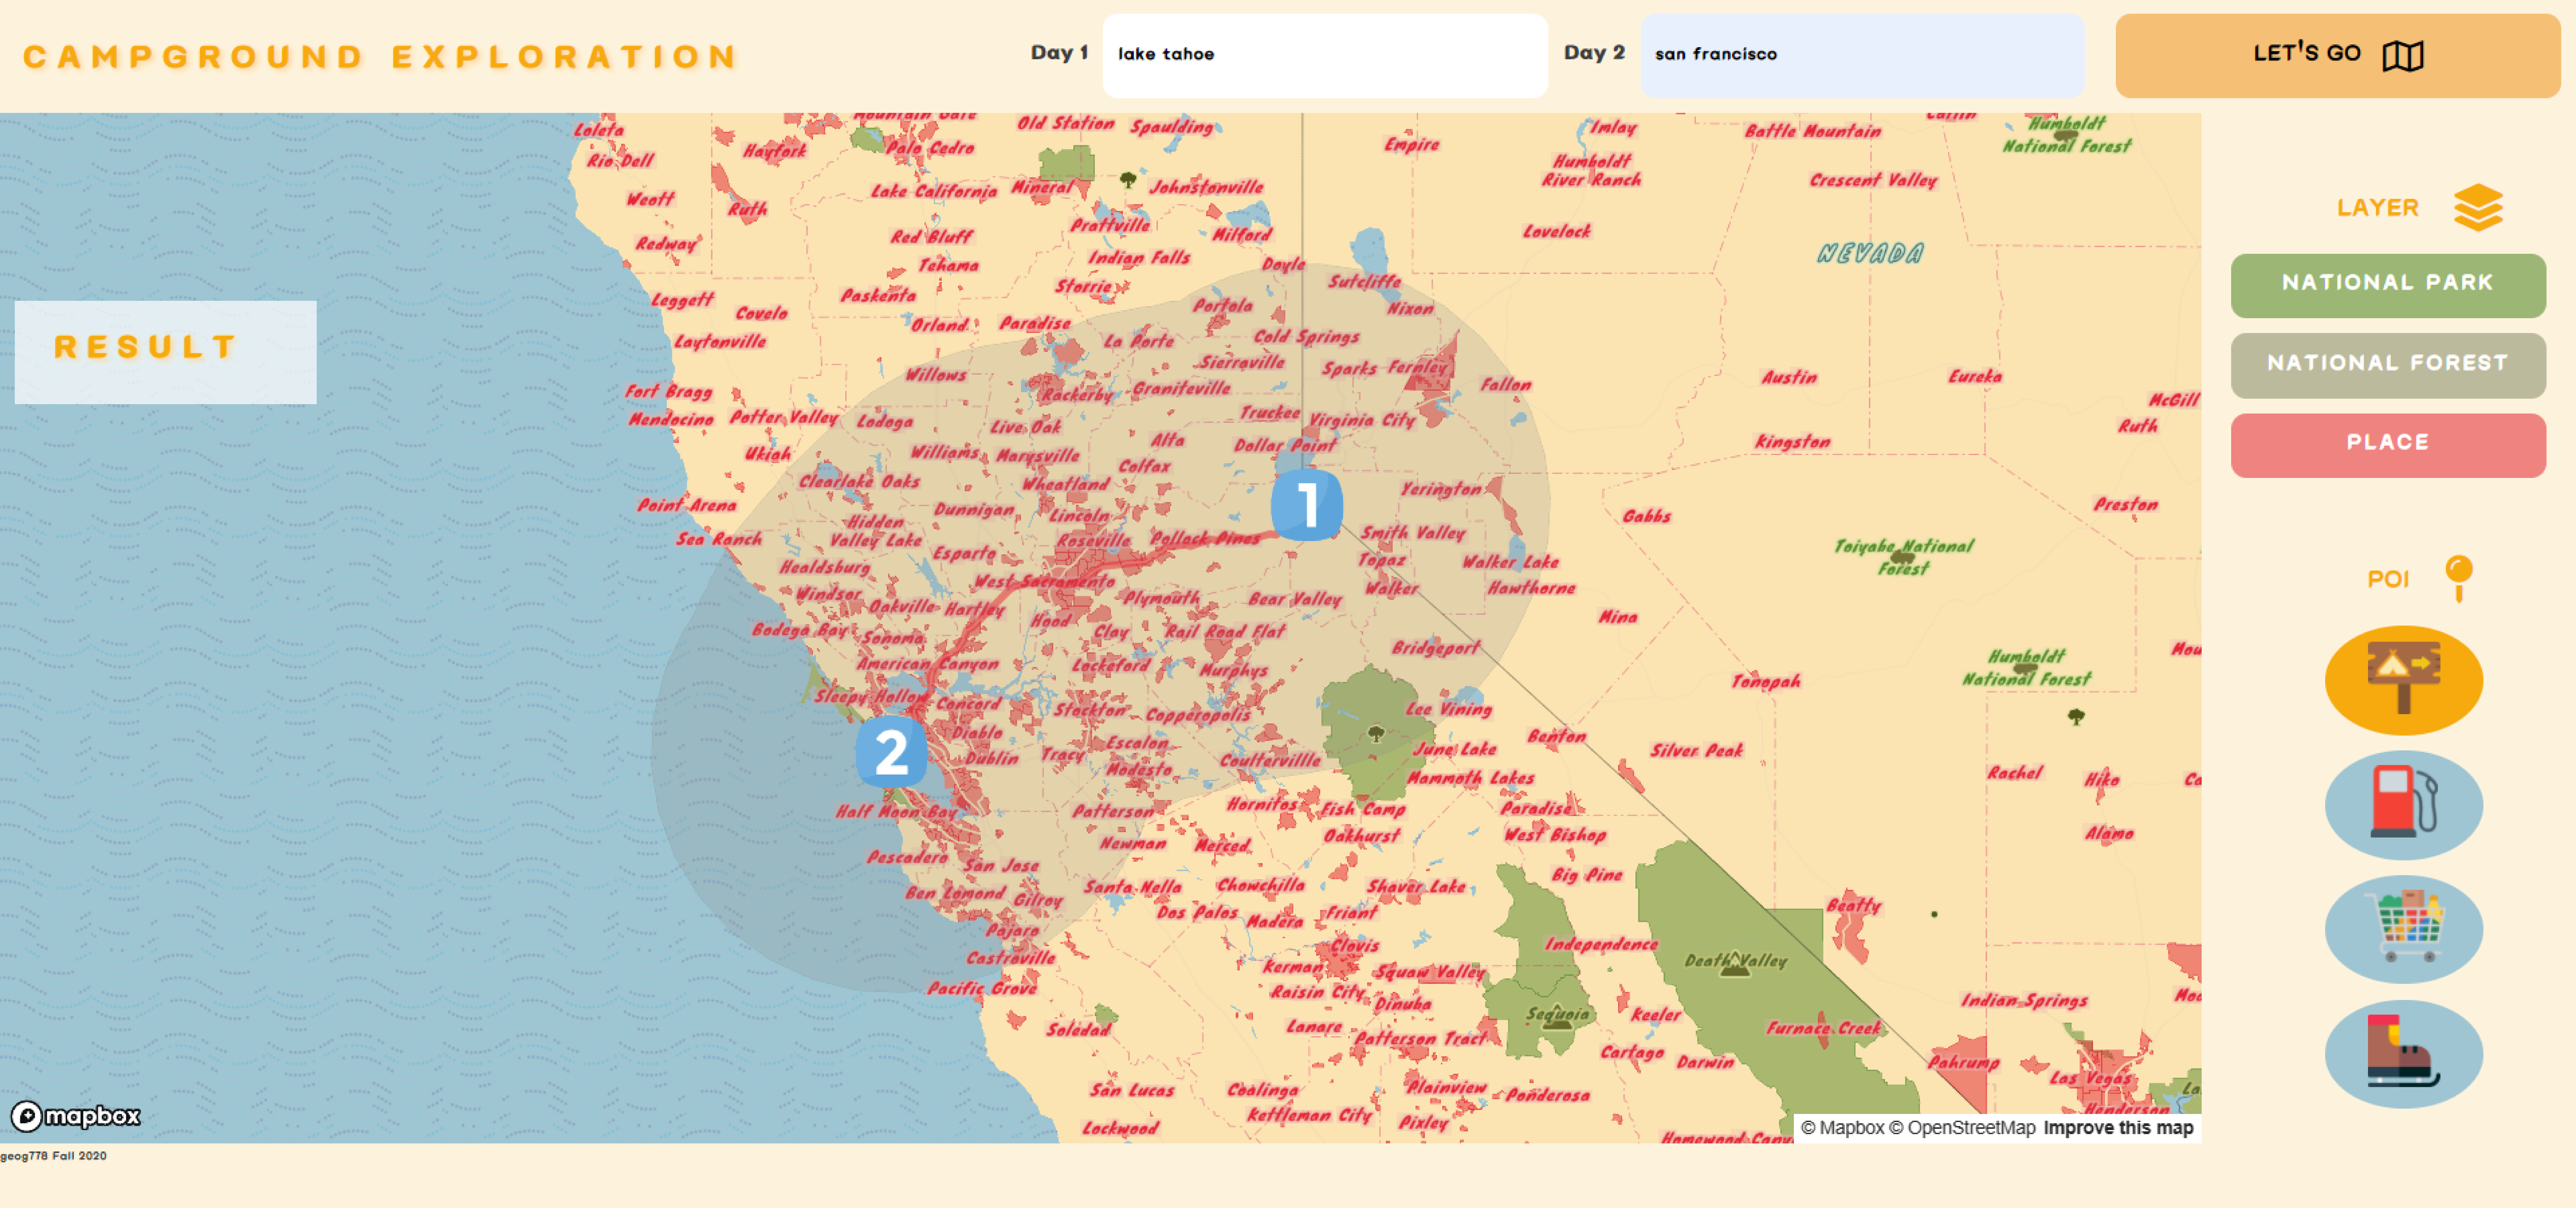
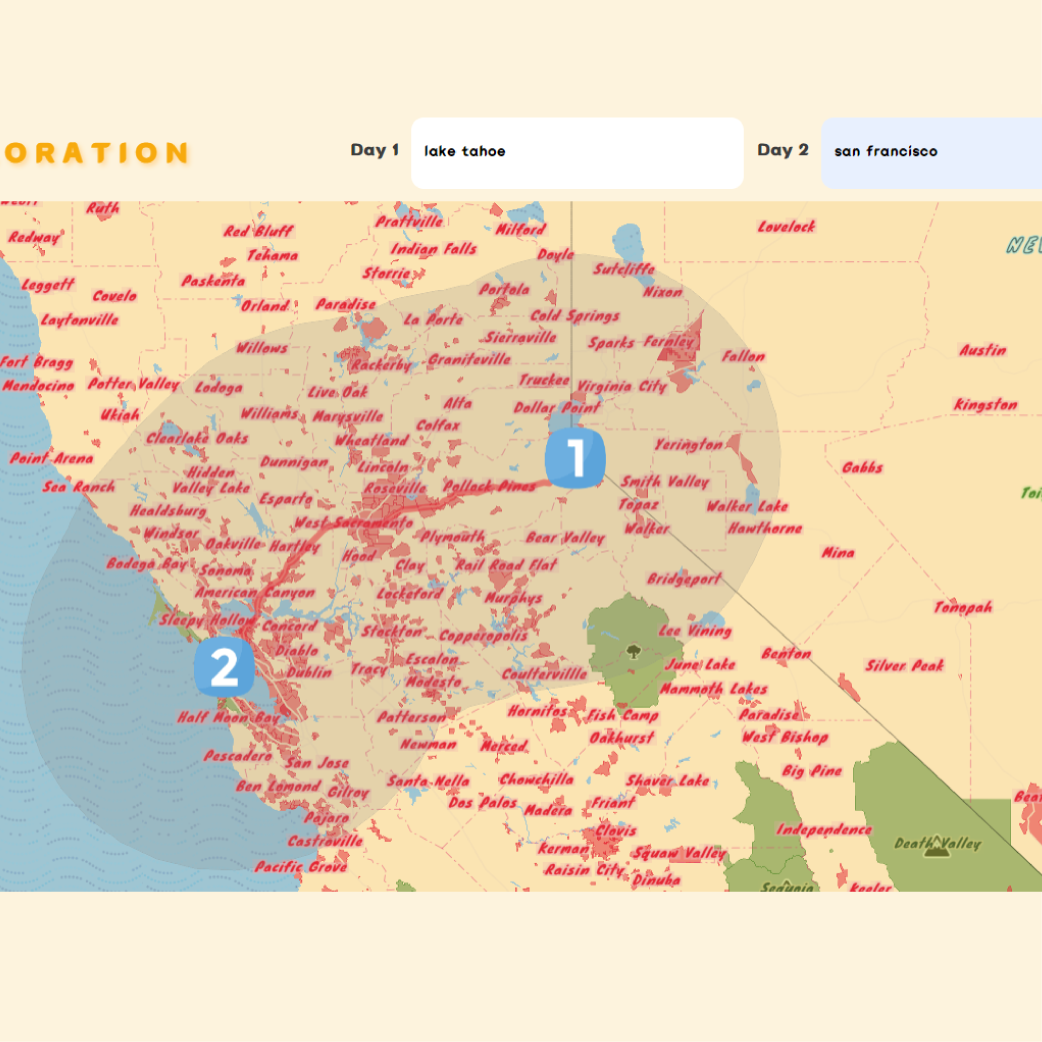
A Web Tool in Interactive Cartography
As a hard working citizen living in big cities and with increasing interest in outdoor activities, a weekend trip in nature will probably serve as the best comforts, but some of them don’t want to be too “off the grid” while make a brief excursion in nature, who are exactly what this planning tool works for.
As the development of the camping related apps on the mobile devices , such as The Dyrt, Recreation.gov, Campendium , Hipcamp, the people of outdoor type always benefit from these map based apps when or before hitting the road to stay connected to the wild. While they are mostly designed in app form and usually focused on the diversity of the camping styles, the Campground Exploration is an application in web from which features the urban function with the campsites nearby . How citizens connect each other where ver is between cities and nature is the main concern of this application. You can check out the Code on my Github.
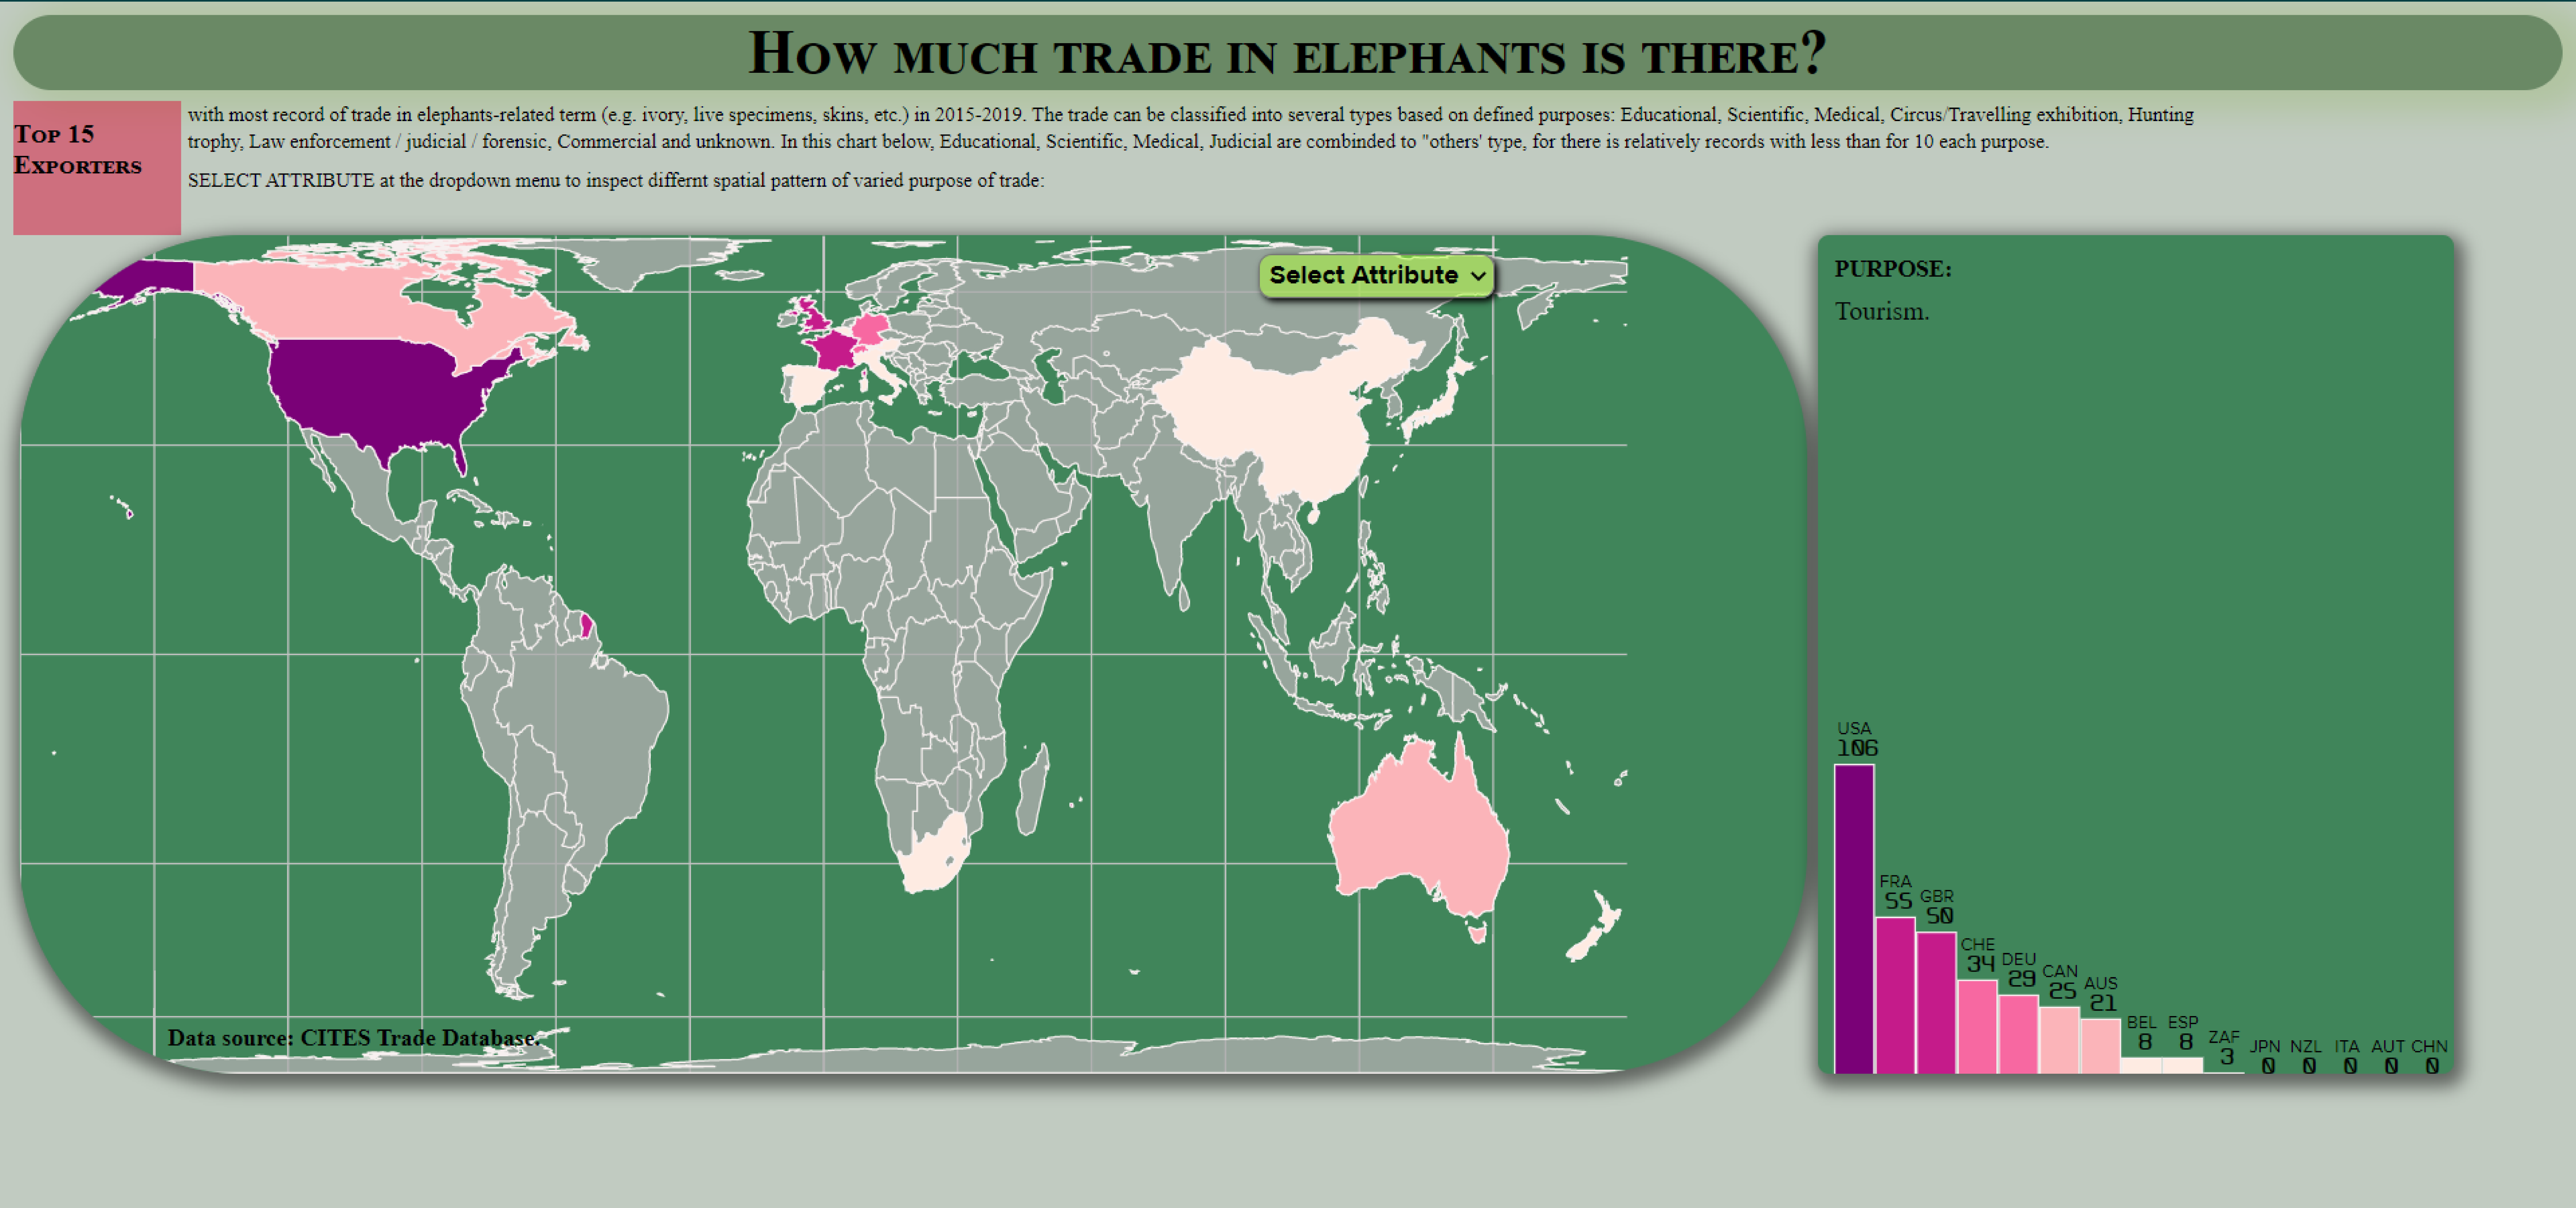
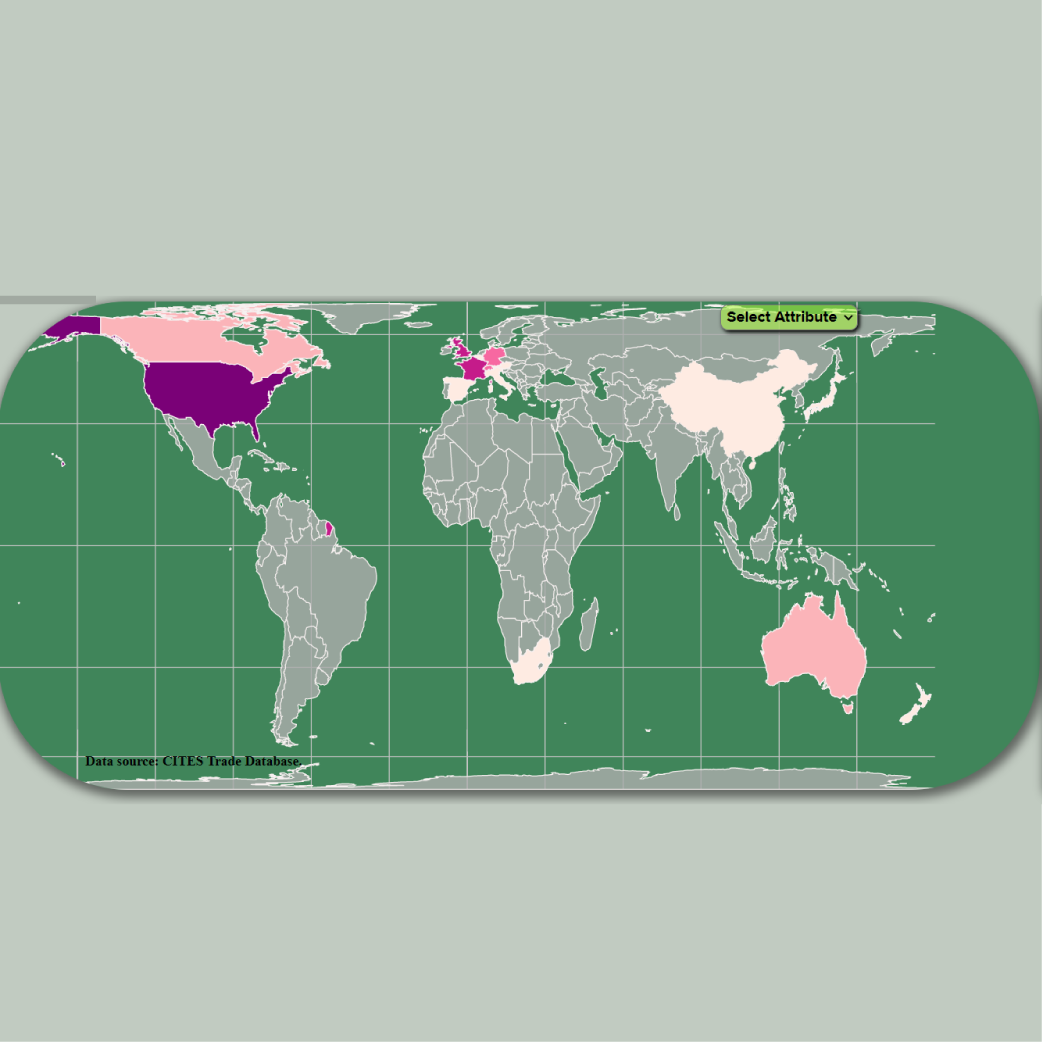
A visualization interactive map with bar chart.
With most record of trade in elephants-related term (e.g. ivory, live specimens, skins, etc.) in 2015-2019. The trade can be classified into several types based on defined purposes: Educational, Scientific, Medical, Circus/Travelling exhibition, Hunting trophy, Law enforcement / judicial / forensic, Commercial and unknown. In this chart below, Educational, Scientific, Medical, Judicial are combinded to "others' type, for there is relatively records with less than for 10 each purpose.
In this tool, you can select the different purpose of exporting to inspect differnt spatial pattern of varied purpose of trade.Codes are public on my Github.

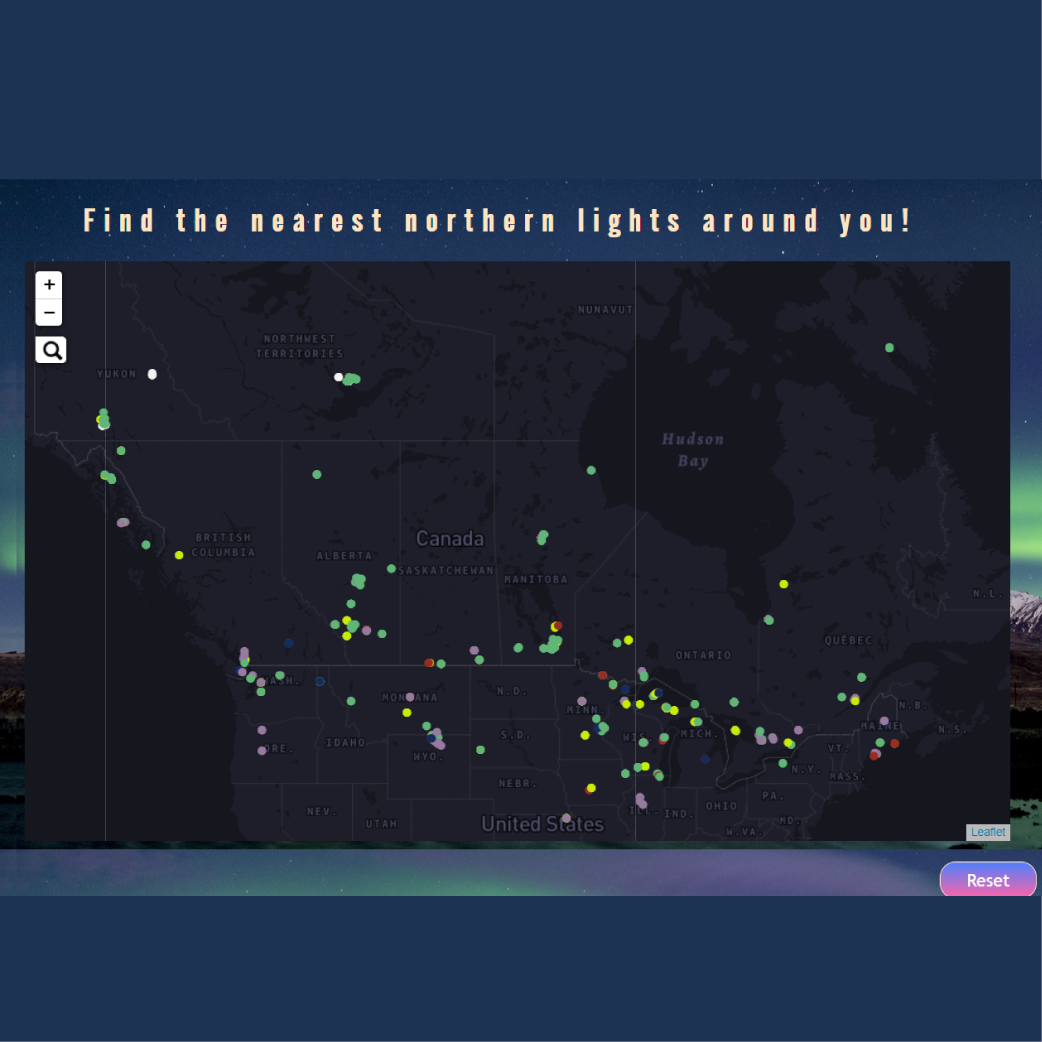
A Web Tool in spatial search and visualization
Possible Persona: A photographer is working for the National Geographic. He has been always interested in spectacular landscape around the world in the nature. The special column he is currently working on is about the diversity of northern lights. Before heading off a trip chasing for lights, it would be better if some patterns of northern lights have been explored. He would like to delve into some data which is present-to-date. For example, which places is closest as well as most popular for him to have the chance to collect the photos of the northern lights, where is most travellers are going to take the photos of the unique pink northern lights and which months most photos of the northern lights are taken by people. These interesting questions are some of the topics he may want to figure out. That is, he needs to rank and compare several sites where these spectacular images are clustered geographically. Using this interactive map, he also might inspect the trend of the northern lights happening, such as which month presents the peak of people taking those photos and posting on social media. Codes are public on my Github.

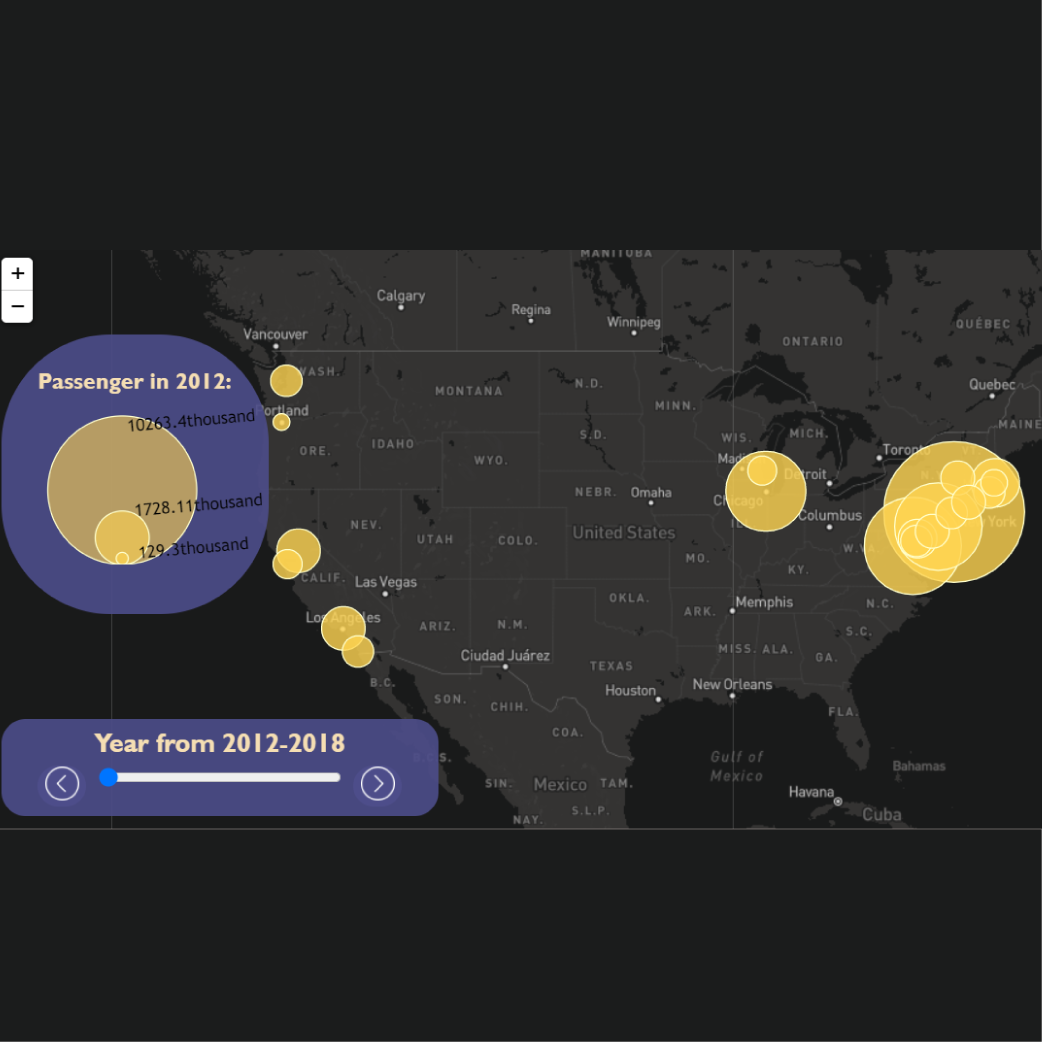
A Visualization bubble Map with sliders
This proportional interactive map consist of top 20 Amtrak Station in U.S. with most passengers check-in and check-out. Check out my Github to see how this basic yet amazing function works for all the mappers!
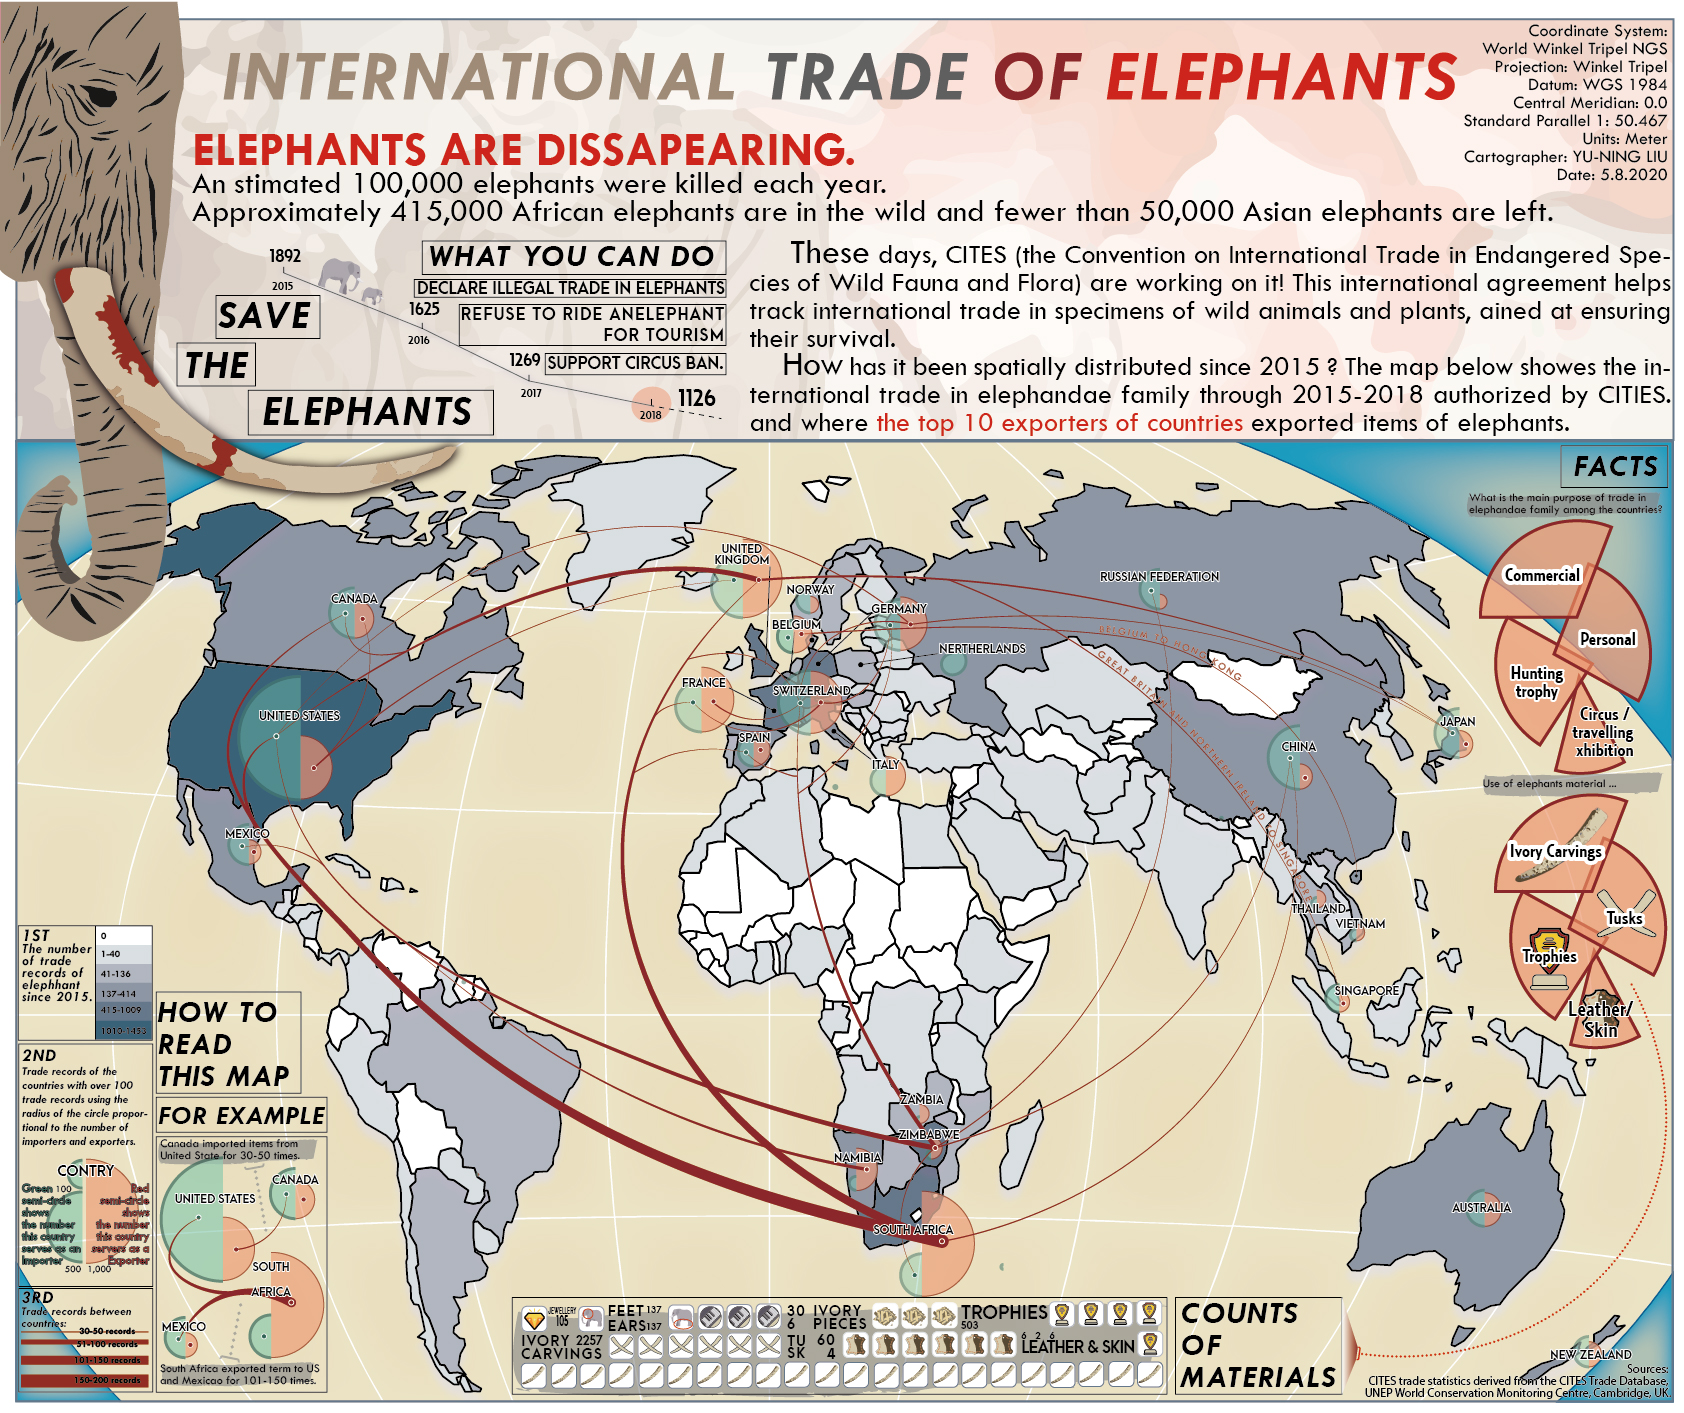
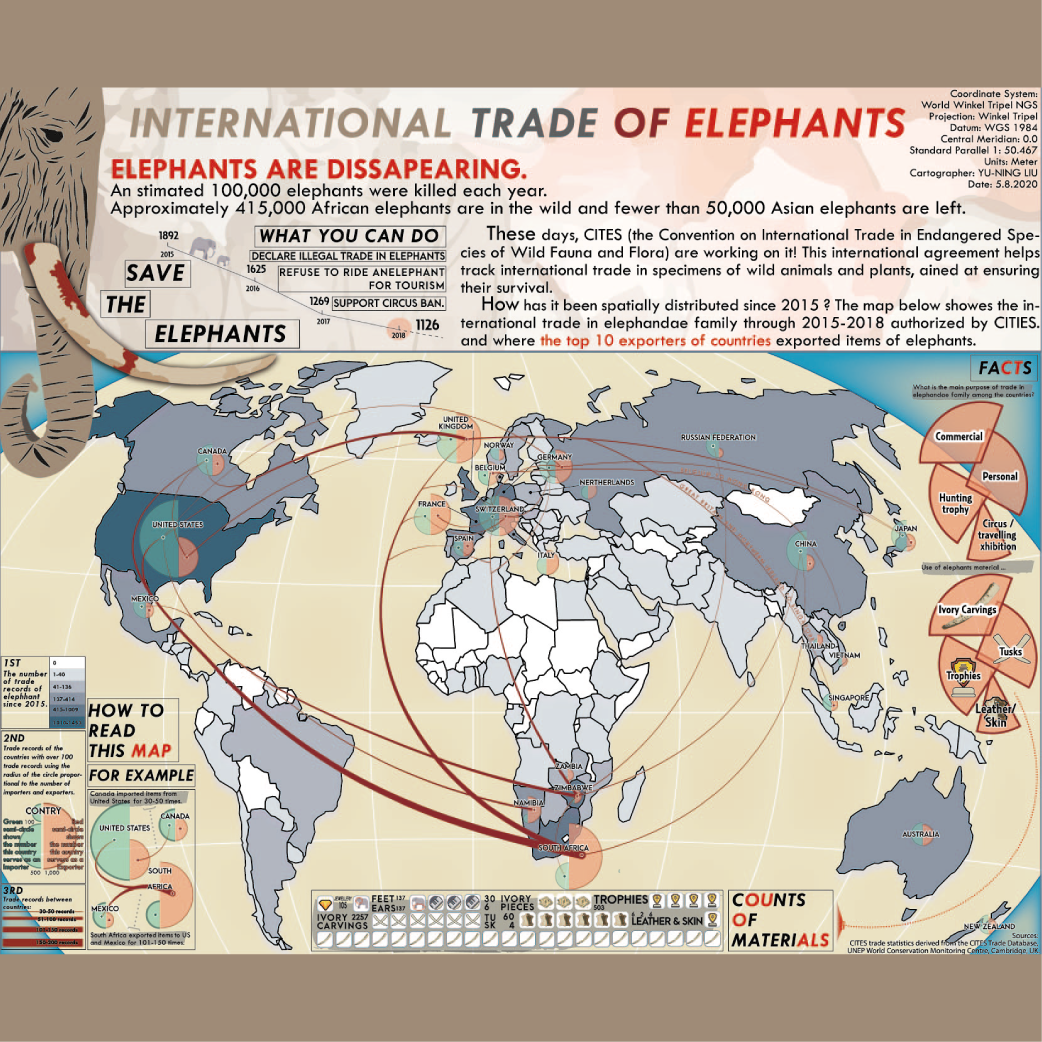
A Static proportional flow map exploring the top 10 exporters of countries that exported items of elephants.
Today, elephants are disappearing. There are various ways from governmental and non-governmental organizations to lessen the elephant trade worldwide. CITES (the Convention on International Trade in Endangered Species of Wild Fauna and Flora) is one of them. Signed by many countries, it is a treaty to build a tracking system to protect the survival of the species in the wild. In this map, I visualized all the legal elephant trade from 2015-2018. The following questions can be effectively answered: Which countries were the leading exporters? How many items did they trade to specific import countries? Which types of materials in elephants were traded most? Click the image and explore its more details.
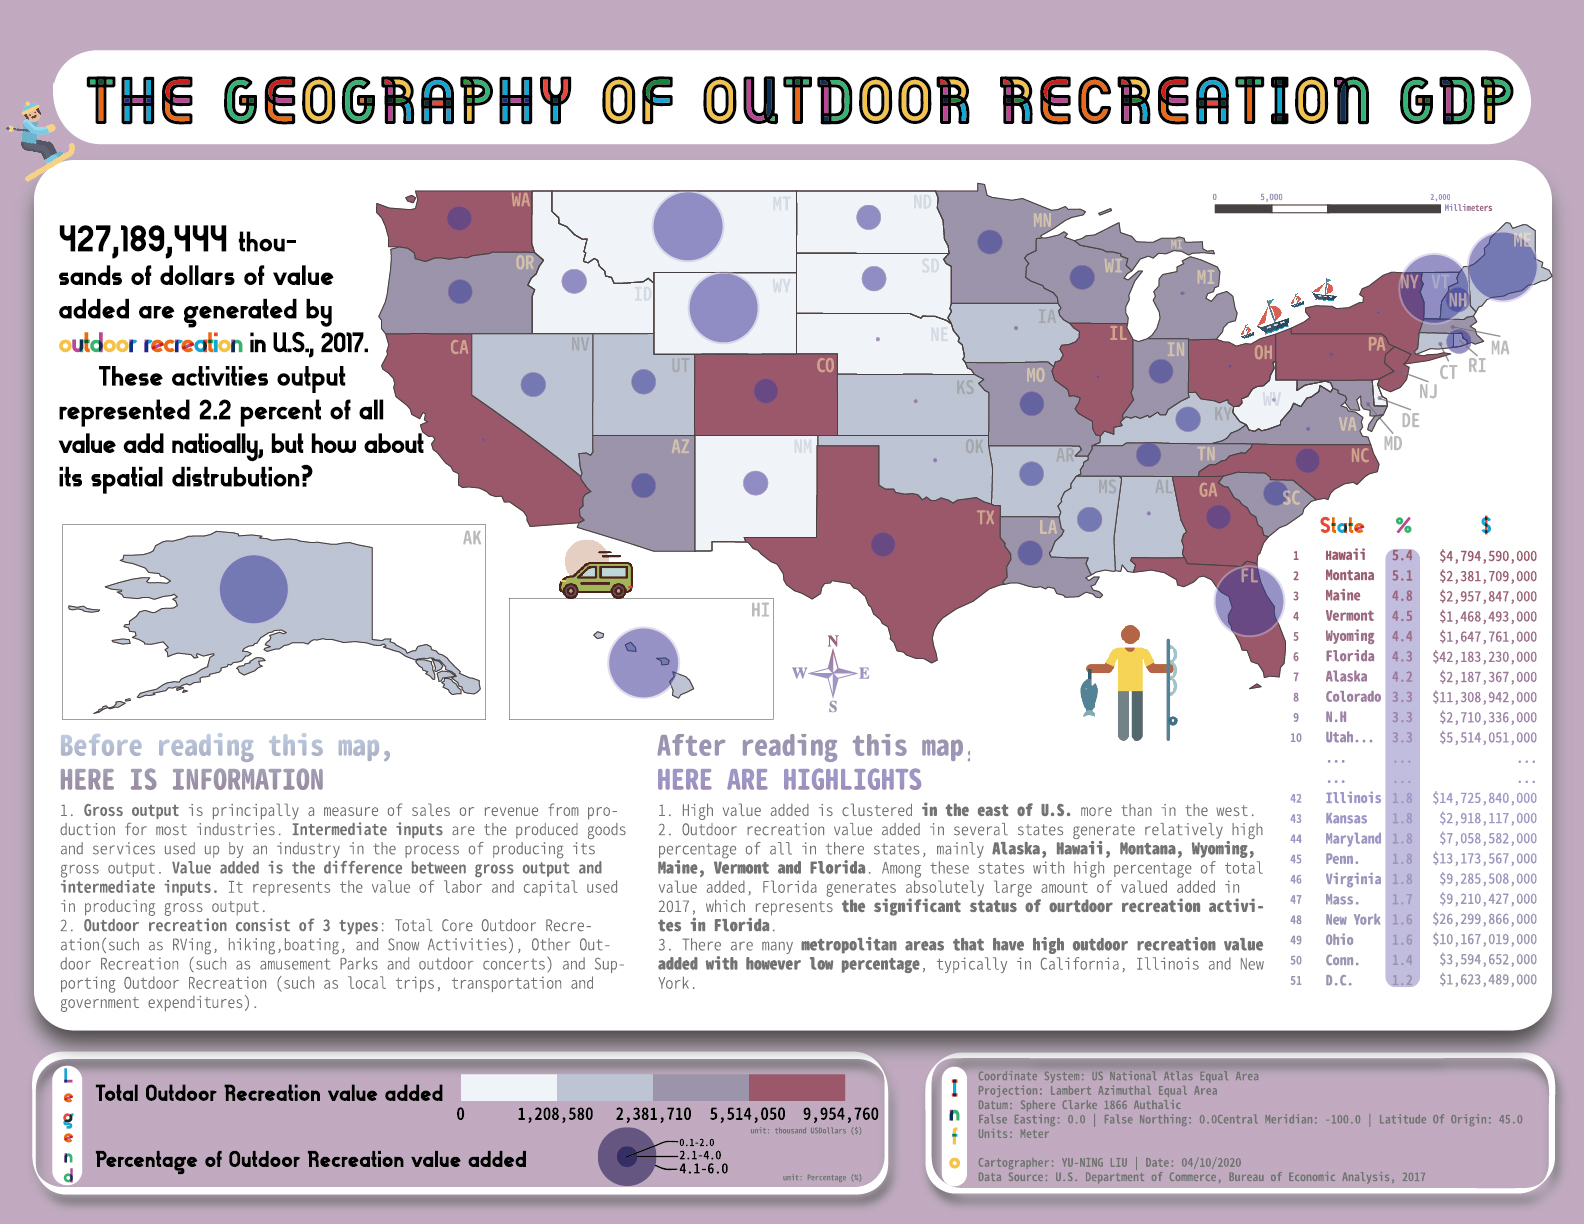
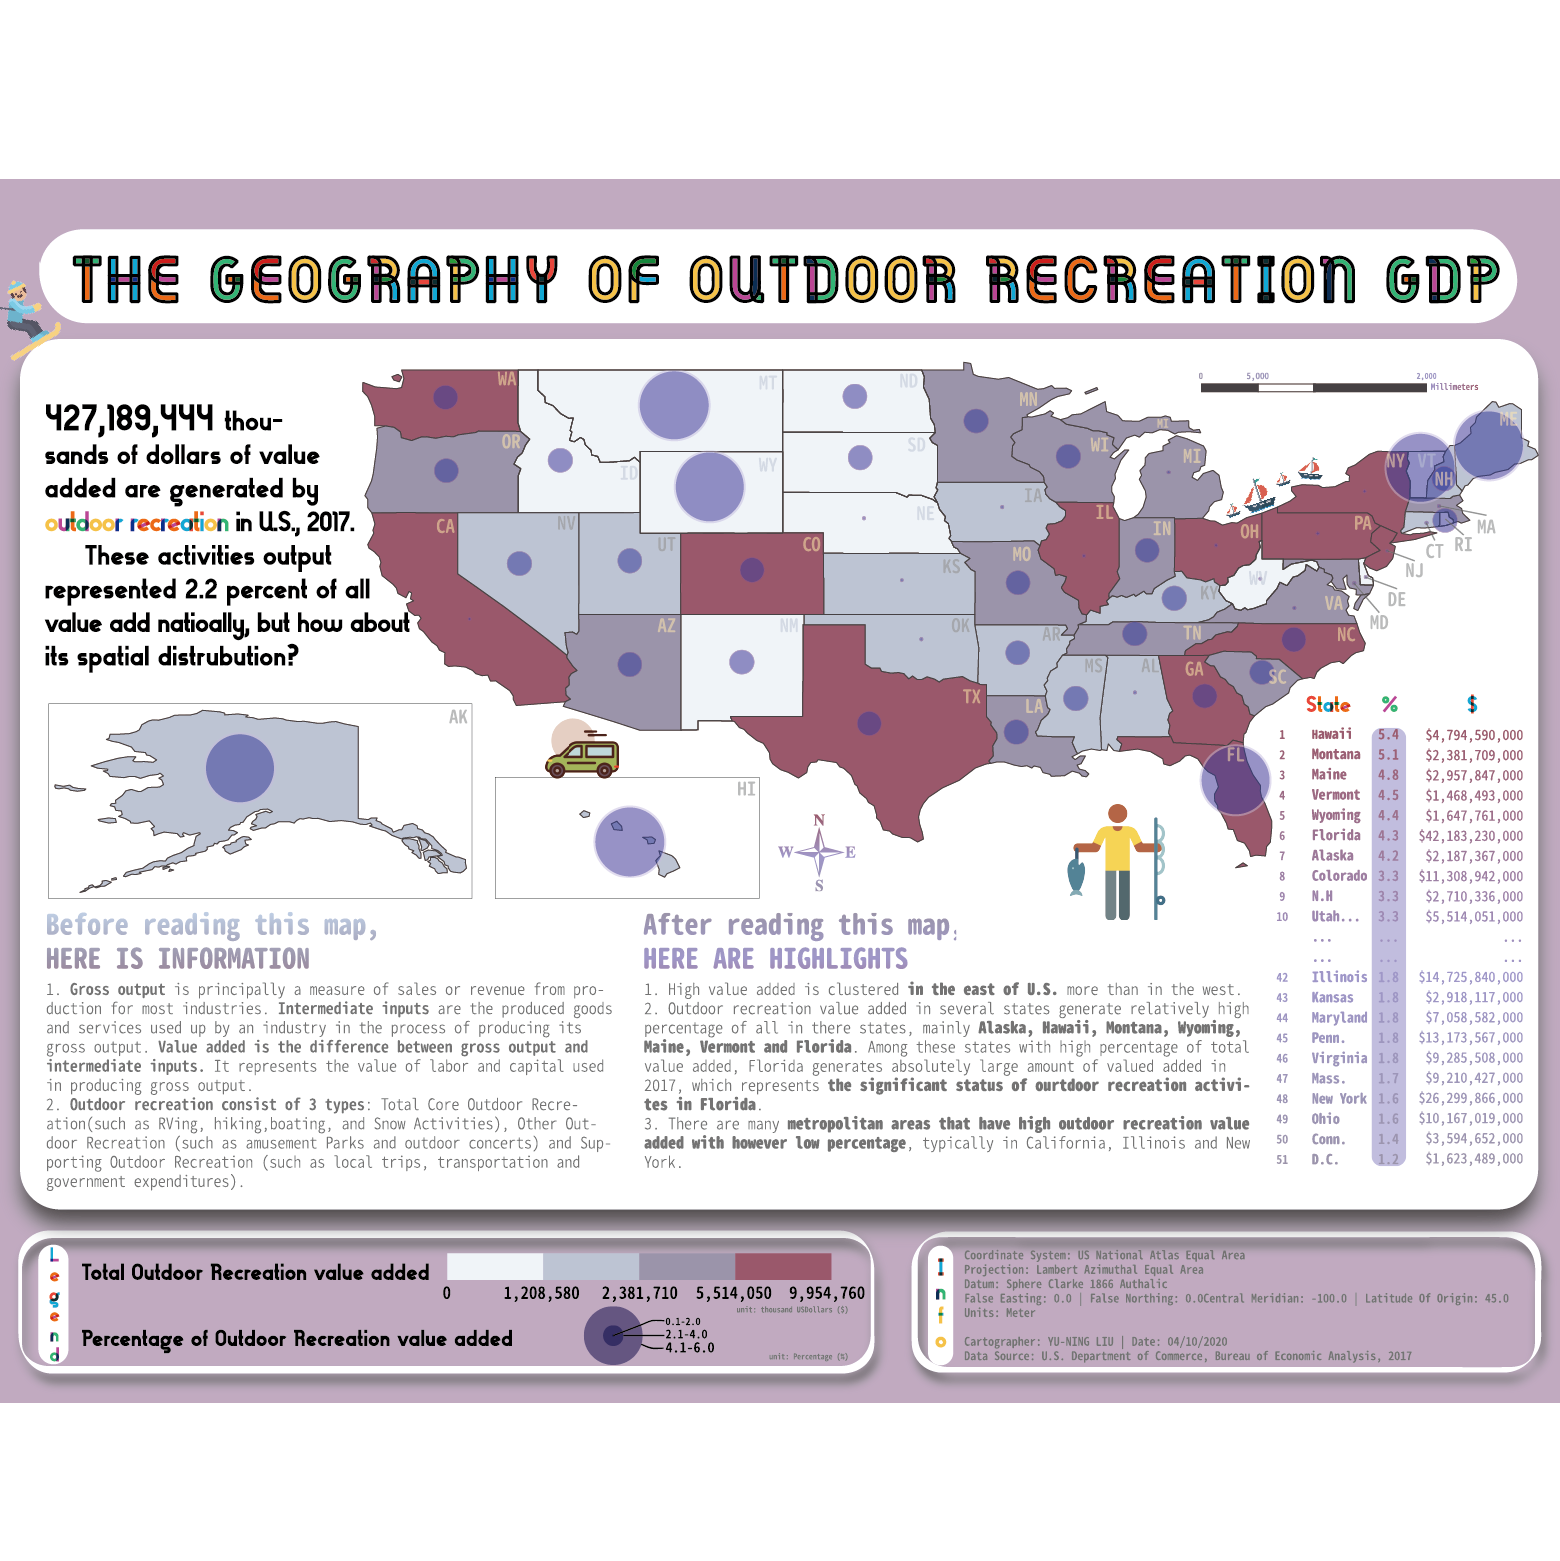
A Static proportional and choropleth map showing outdoor reacreation GDP in each state in the U.S.
In 2007, more than 400 billion dollars of value-added are generated by outdoor recreation in the US. How the value is spatially distributed shows in the figure, where the outdoors consists of 3 types: Core outdoor recreation such as RVing, hiking, snow activities, other one like amusement parks, outdoor concerts, and the supporting one such as local trips, transportation, government expenditures.
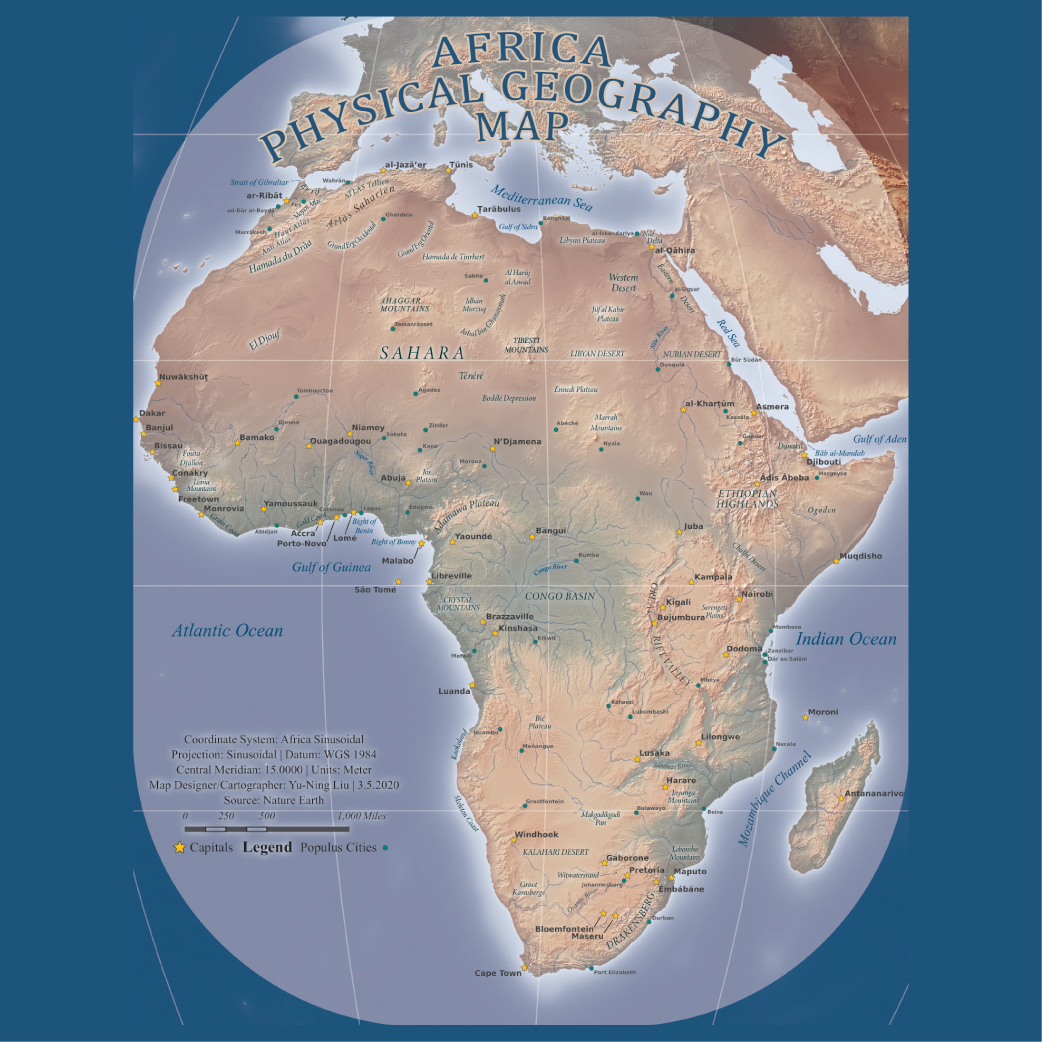
A African map of physical geography.
In this map I played around the label's appearance and the placement of both cities and the physical features. It is interesting and effectively visualized when typography representing rivers follow the path of themselves physically. Also when typography representing inland sea fits exactly the shape of the sea itself. Data source is Nature Earth.
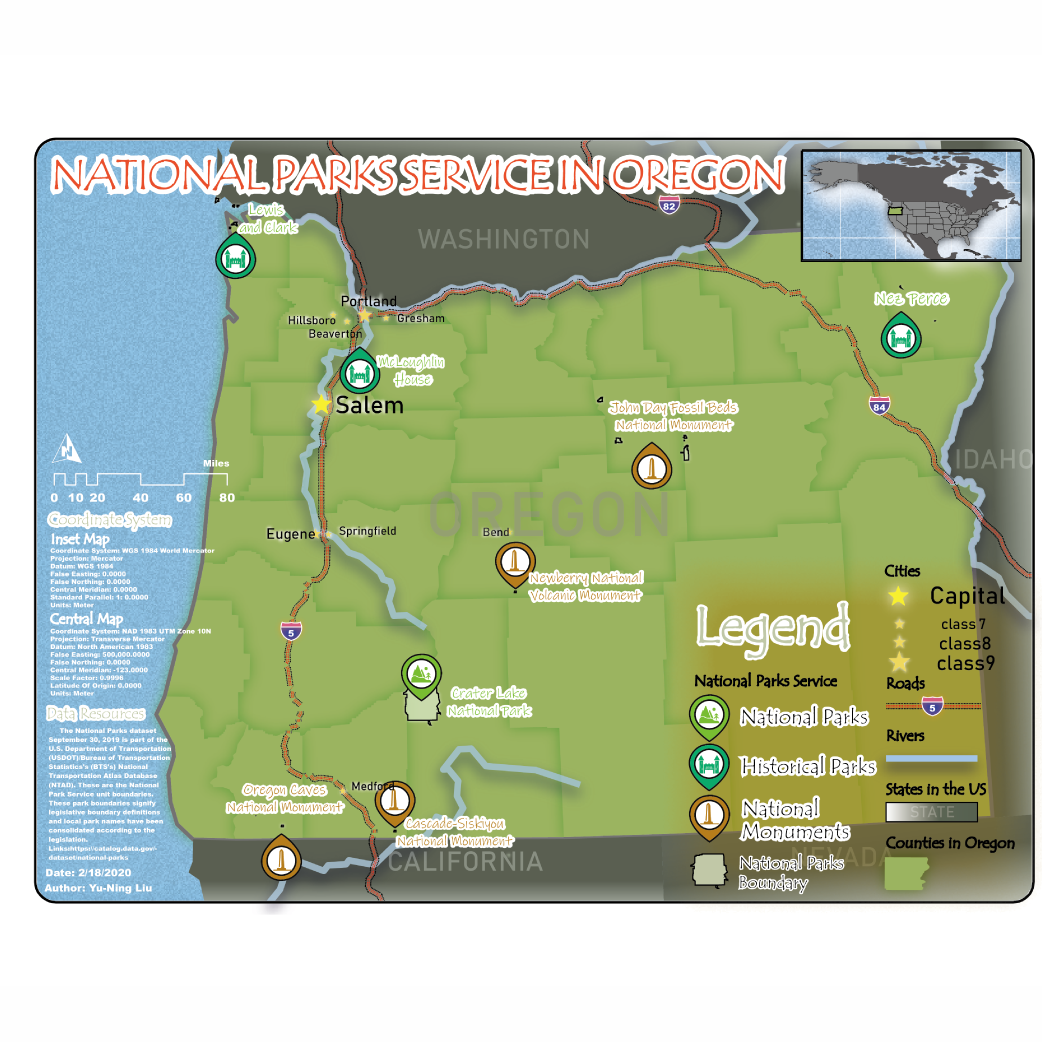
A Static map visualizing state-wide national park services in Oregon.
There are several national parks, historical parks and National monuments are located in Oregon State. From this map we can easily have a brief understaning of all the spatial relation between the national parks services amd the asministrative boundaries, as well as the main cities in the state. US Forest Service (USFS) which is under the Department of Agriculture is not included in this map because it is not affliated with NPS, which is under the Department of Interior. Find more related info about the difference between NPS and USFS here.

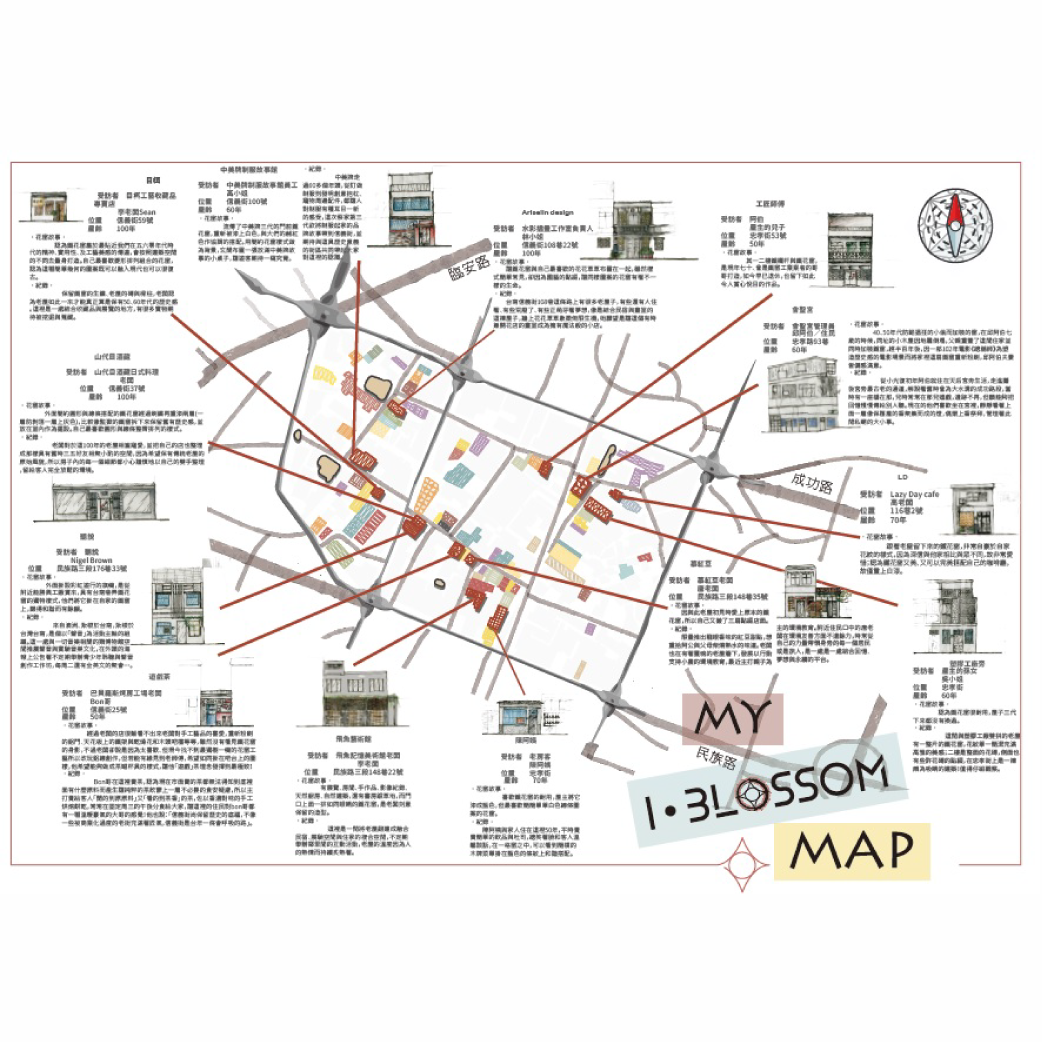
A static map combining the street networks and the special pattern of the window on architecture in Tainan city, Taiwan.
Tainan is the oldest city in Taiwan. Its anitique feeling immersed in the histroy and the wrought iron window complement each other perfectly. This work is mainly to mapping the location of the buildings with special pattern of their iron windows and designed elevation. you can also check the website introducing this historical areas with its aesthetic of the craft here.